Maximizing social benefits through risk management
May’s beautiful spring weather makes it a perfect time to celebrate Bike Month. People are shrugging off the cold winter months, and the spring’s cool sunny days are ideal for pedaling. Bicycling provides many benefits to the rider and to their community. It encourages a healthy population who become engaged on local streets, bolstering businesses on the route. For each cyclist no longer driving a car, there is a decrease in traffic, smog, and carbon output. When combined with transit, biking solves the “last mile problem,” where transit riders must make their way home from busiest streets. Cycling commuters can quickly travel from a transit hub.
Solid cycling infrastructure supports these excellent benefits at the city and community level. Safe, separated bike lanes make a difference to ridership rates. Hesitant riders are more comfortable when the built environment is safe and simple to access. Armed with this research, municipalities are investing in cycling infrastructure, and have been rewarded with increased ridership. Toronto, Washington DC, and other cities across North America are seeing major increases in commuting bike share.
Statistics on bicycle accidents
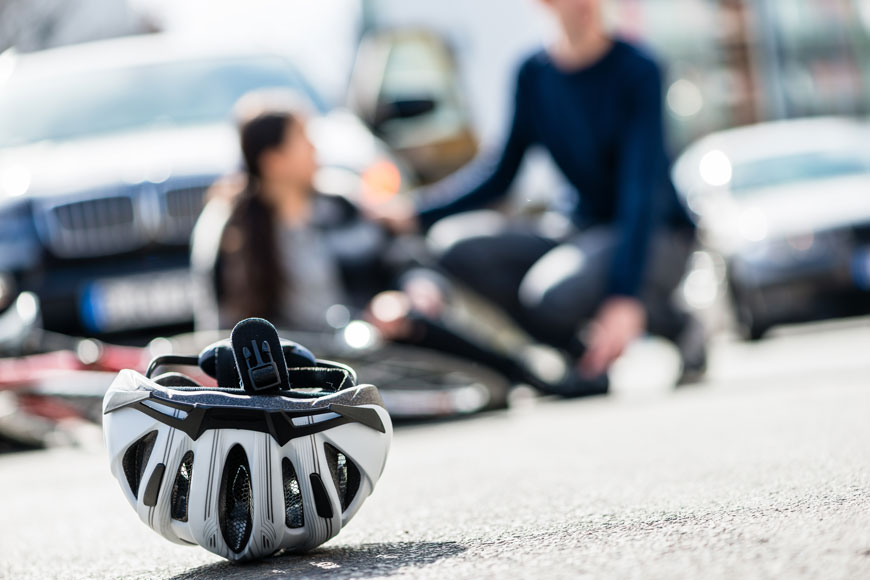
Municipalities investing in active transportation networks need good statistics to measure success. One measurement is already readily available through national traffic monitoring systems. Traffic accidents involving cyclists are a measure of network safety. Infrastructure improvements with the goal of lowering bicycle accidents often increase ridership.
In the United States, the National Highway Traffic Safety Administration (NHTSA) monitors bicyclist injuries in traffic accidents. Their statistics show a nationwide rate of 19 cyclist injuries per 100,000 residents.
Bikeparts.co.uk, a cycling blog in the UK, did an investigation of cycling injury and fatality rates for Great Britain and the EU. The rates vary widely by region. Scotland, on the low end, has a rate of 13.3 injuries per 100,000 residents. In comparison, London has 51.0 injuries per 100,000. In North America, there is likely as much variation state by state and city by city, but these numbers are not readily available.
Bikeparts also explores cyclist fatality rates per million inhabitants across the EU. There’s a wide range here, too, with an average of 4 deaths per million inhabitants in the EU. Great Britain’s number is low, with 1.6 deaths per million residents. Compare this to Romania’s 8.9 per million inhabitants.
According to the NHTSA’s Fatality Analysis Reporting System, the United States has a lower rate than Great Britain, with 1.2 cyclist fatalities per million inhabitants. This number has been dropping since the 1980s, when the high was 4.2 fatalities per 1,000,000 people.
Cycling fatalities per 1,000,000 residents, by State (2016)
The NHTSA has state-by-state numbers on fatalities per million residents which echoes Bikeparts’ EU studies.
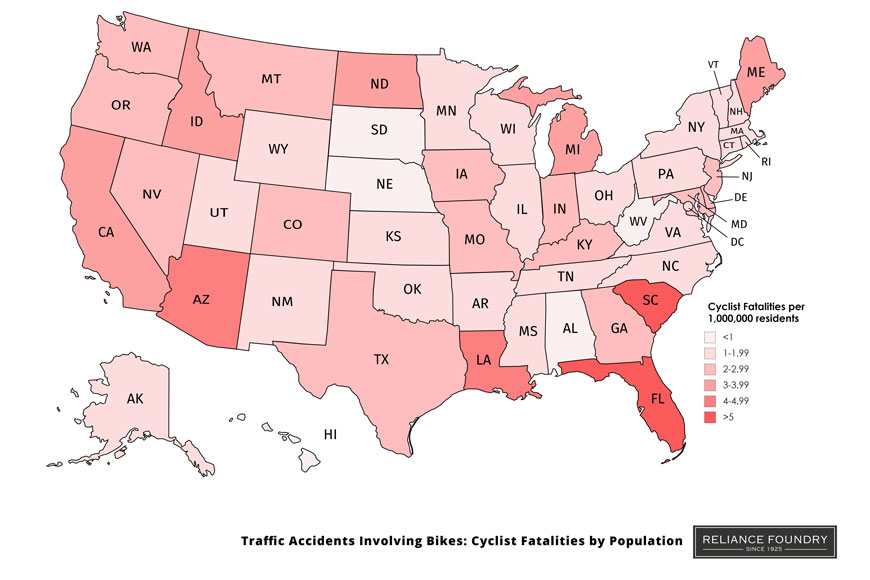
This data hints at a more complex picture than an aggregate national rate. Because injury and fatality rates are roughly correlated, these numbers show which states are struggling more with safety than others.
Challenges with measuring cycling safety
Fatalities per million residents do not necessarily explain the specific problems with safety in a region nor point to the solution. Many factors contribute to aggregate rate—some of which are easily measurable, and some which are less so.
Cycling population
Some states with very low cyclist fatalities are not necessarily safe for riders. Rates may be low because there are few bikes on the road. In 2016, Alabama only had 0.6 cyclist deaths per million residents. However, according to that year’s statistics from the League of American Bicyclists, it also has the third lowest statewide percentage of bike commuters.
As the cycling population increases, so might the total number of fatalities and injuries, even if the risk of accident stays the same for any individual rider. However, more cyclists on the road also encourage more awareness and driver caution. A more active cycling population will start decreasing the risk to the average rider.
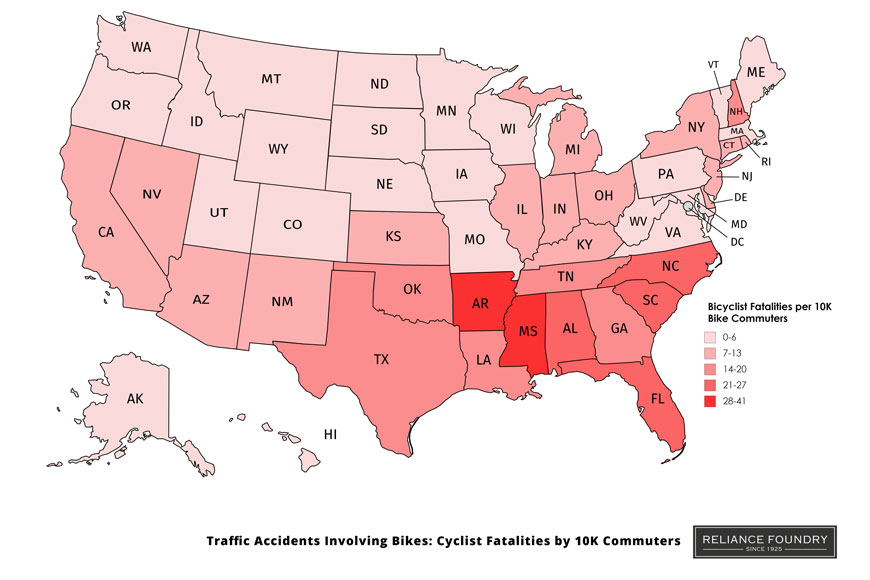
The League of American Bicyclists captures some of this relationship by documenting rider fatalities per 10K bike commuters. This is still an incomplete number, since it does not capture leisure or errand biking. The following map is based on averages from 2011-2013 and gives a better sense of overall cycling safety. Comparing it to the previous map suggests that Alabama’s few fatalities are due to very few riders.
Population density
Shared road space can be more dangerous as competition increases for a bit of pavement. Traffic density leads to an increase in accidents. In urban environments it also tends to lead to a decrease in motorist fatalities, because speeds are lower in cities. Lower speeds are not as protective for exposed riders. Collisions between vehicles and cyclists are always dangerous to cyclists.
However, the density of urban environments can make them more culturally responsive to changes in infrastructure. Washington D.C, for example, is one of the most populous US cities, with a very high percentage of active commuters. However, according to the League of American Bicyclists, it also is the safest city for active commuters. Infrastructure investment and a culture that supports all commuters make it safe.
Transportation culture
Both bicycle culture and driver culture are important factors in cyclist safety.
12.3% of cyclist fatalities in 2017 in the United States came from being invisible: dark clothing and no lighting can be deadly. Casual cycling cultures may not encourage or emphasize lights and reflective gear. Urban commuters are more likely see other cyclists on the road who can warn them if they’re invisible. In some regions, lack of appropriate lighting may lead to a ticket. 20.6% of fatal bicycle accidents occur between 6-9pm, either as the sun goes down or after dark.
Another big part of the cultural conversation is shared understanding of the rules of the road. Failure to yield right-of-way, by cyclist or driver, accounted for a quarter of cyclist fatalities in 2017. Where rules and traffic patterns are changing, road users often don’t know what to do. In areas where there are few cyclists, drivers may not be looking for them.
Oslo, Norway is currently attempting to underwrite a massive shift in culture and behavior between cyclists and drivers; one of the fastest roll-outs of a new approach to transportation. Legislatures around the world are watching to see how this cultural shift can be supported.

Transportation infrastructure and laws
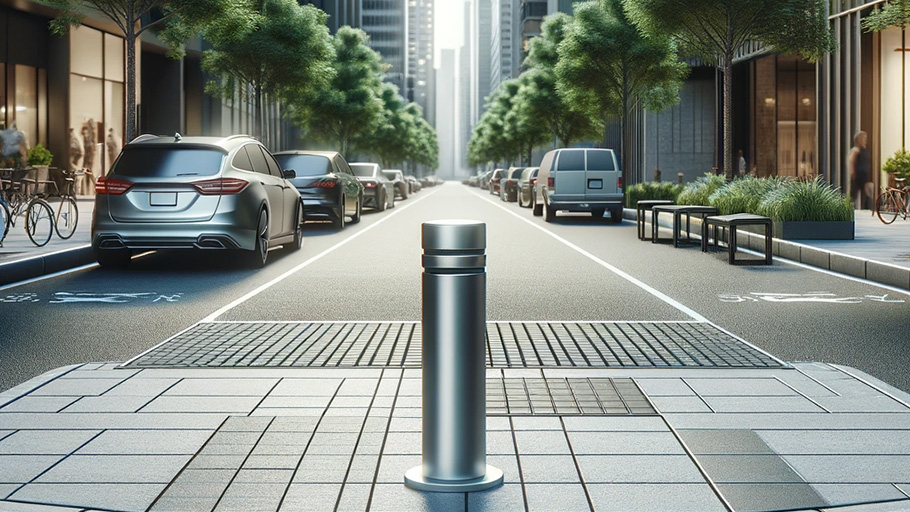
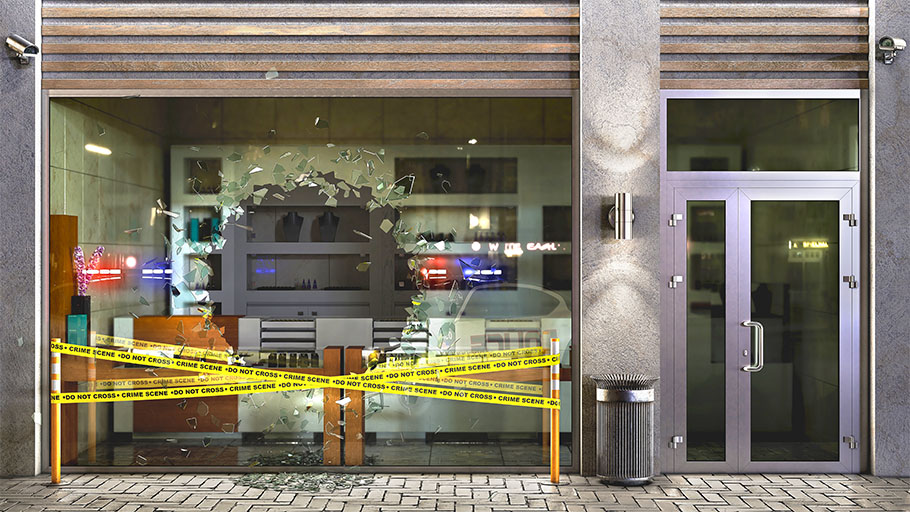
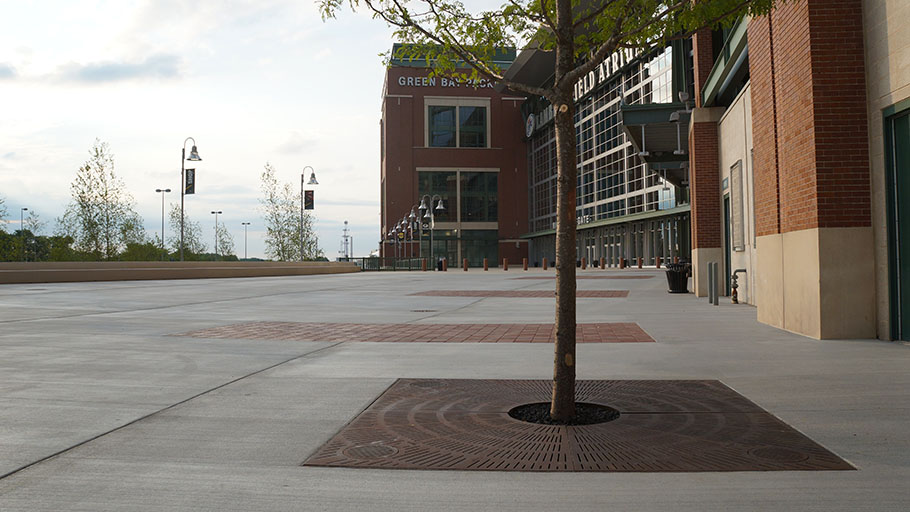
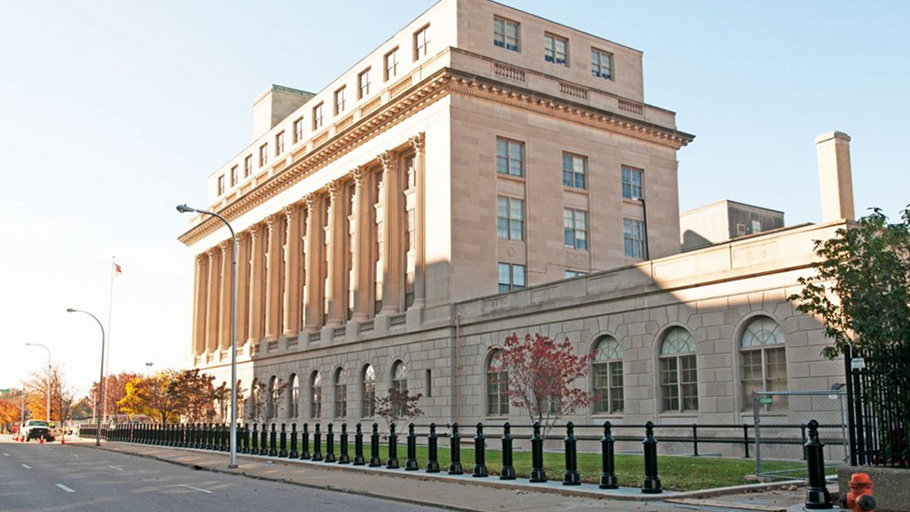
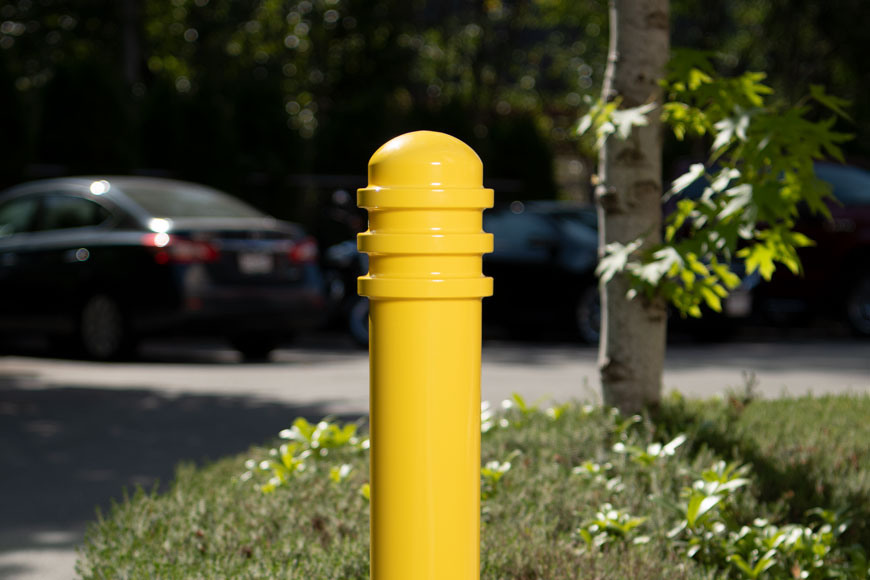
Design of bike paths and traffic laws each affect the likelihood of bicycle accident when road sharing with other cars. A 2009 review of current literature demonstrates that bike infrastructure increases safety. Separated bike lanes—either off road or using bollards, curbs, or planters—are the safest place for cyclists to travel. Secure bike parking allows people to feel like an investment in their ride will be worth it: targeted bike theft is one of the ways people become discouraged from riding. Showers at work are a bike-friendly add for employers—as are offering things like bike pumps, tire patches, and chain lubricant.
Laws also vary from state to state and these also make a marked effect on pedestrian and cyclist safety. Is a bike a vehicle that can take a lane? If a car passes a cyclist, what is the minimum distance needed to pass? What’s appropriate yield behavior at an intersection? Laws supporting cyclist safety are very different in each area.

Infrastructure supports a cultural shift
Installing bike infrastructure supports rider safety in several ways.
Good infrastructure is protective. A small lapse of attention from a driver is more deadly to a cyclist or pedestrian than to another vehicle. Separated lanes prevent small lapses from becoming big tragedies. Creating separated lanes also prevents routine conflict over space. Cars and bikes have different needs, speeds, and reaction times; setting the two transportation modes apart means less frustration.
Increased separation allows people of a greater range of abilities and ages to experiment with cycling. Otherwise, it is the only most physically fit and confident riders who take to the streets. Installing adequate commercial bike parking or bike lockers at transit hubs can encourage tentative riders too, by enabling commuters to ride for part of their route, if the full distance is too far.
Increased bicycle traffic, with riders of all ages, abilities, and backgrounds, begins to change the cultural sense around biking. In places where bikes are for kids and only a single adult demographic, there can be antipathy to it as a mode of transportation. As more and more people adopt cycling, it becomes less and less foreign. Where lots of people ride regularly, drivers are more likely to be watching for riders. There are fewer road conflicts because the patterns of bike riders are better understood. In places where almost everyone rides, like in the Netherlands, vehicle drivers are usually also cyclists, and vice versa. Mutual understanding and respect go a long way towards creating more safety.