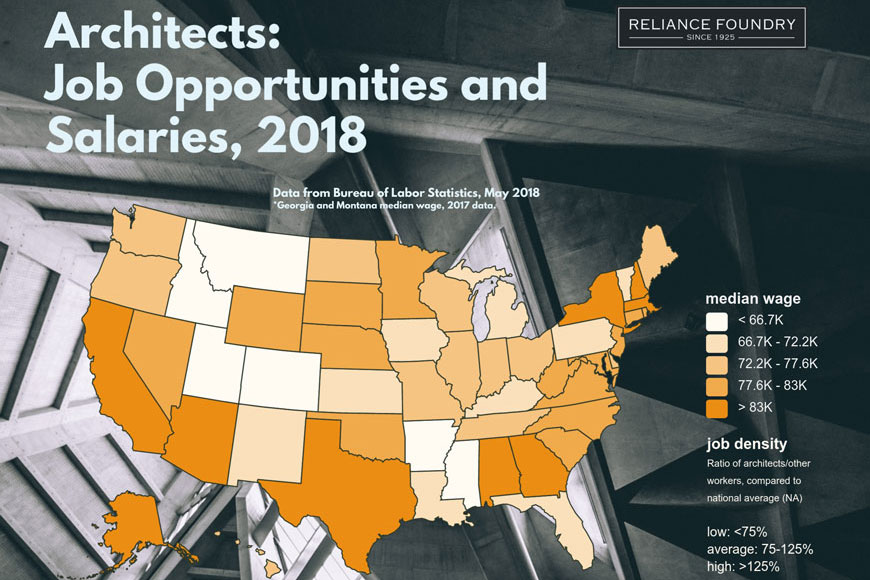
A look at the employment data for architects in the United States
As makers of site furnishings, hardscape, and traffic management, we are often specified by architects. With every group of customers that we work with, we stay abreast of the trends and frustrations that make up their working lives, in order to provide better service.
In the course of this research, we found salary and job statistics last year for all the planning professions. The post was popular, and we still have the research records that are now otherwise unavailable online. We looked at the data year over year and found some interesting (and some baffling) trends.
Architect job trends, 2017 to 2018*
Median wage
There are two ways to report on wages:
- The median income represents the midpoint on the wage scale. Half of employees make more than this number, half make less.
- The mean (average) wage represents all the wages added together and divided by the number of earners. Mean incomes are often higher than median incomes, due to the presence of very highly paid “superstar” professionals.
The national median wage for architects in 2018 was $79,380. This represents an 0.8% increase over 2017. The annual inflation rate for 2017 was 2.1%.
Median wage growth for architects varied a lot state by state, in the data given by the OES.
In the above graphic, you can mouse over each line to see the year-over-year change in the state. Not all state names fit in the legend, but they’re on the chart in alphabetical order.
- Massachusetts had the highest median wage, at $93,920
- Arkansas architects receive the lowest median wage, at $63,220
- Hawaii had the greatest median wage loss: -10.6%, or $9,040
- Hawaii’s new median wage still is now just below the national average at $75,910
- The District of Columbia had greatest median wage gain: 13.7%, or $11,130
- DC’s 2018 median wage is $92,490
Job growth
- Nationally, 1,250 new architect jobs were created, not including self-employed architects.
- This is a 1% increase of employment in the field.
- In 2016 the Employment Projections program predicted 550 new hires/year into the field, so growth has been stronger than expected.
- Current projections suggest architectural job growth over the next decade may be 8%
- This works out to 1,120 new jobs created/year.
*Source: The US Bureau of Labor Statistics, OES National surveys, May 2017 and May 2018.
Best and worst places for architects
We investigated the OES data for metropolitan and nonmetropolitan areas to see if there were any surprisingly architect-friendly locales. The greatest number of architecture jobs are, unsurprisingly, in the most populated urban census areas.
- Top spot goes to the New York, Newark, and Jersey City area with 11,800 architects.
- LA, Long Beach, and Anaheim area is runner up, with 5,770 architects.

Number of architects in the workforce
More interesting are regions that have a much higher or lower ratio of architects as part of the overall workforce than the national average.
- Missoula, Montana has 160 architects. This means there is one architect to every 340 workers. This is 3.74 times more than the national average, and the highest ratio in the country. The next high ratio cities are:
- Lawrence, KS (3.18 times national average)
- Boulder, CO (2.91)
- Denver, CO (2.52)
- Seattle, WA (2.47)
- San Francisco (2.31)
- Hilton Head Island (2.09)
What places have a surprisingly low number of architects? Excluding nonmetropolitan areas that often have fewer jobs in architecture, the cities with much lower workforce participation than the national average are:
- Greensboro, NC (0.136 times national average) and Fayetteville, NC (0.24)
- Springfield, MA (0.17) and Worcester, MA (0.219)
- McAllen, TX (0.3), right on the Mexican border
- Evansville, IN (0.221)
- Fresno, CA (0.258)
Median wages for architects
The three areas with the lowest median wages are:
- Port St. Lucie, Florida—This town, located halfway between Miami and Orlando on the Atlantic coast in southern Florida, has 50 reporting architects. Their median wage is $48,480. The average or mean wage is much higher, at $66,120.
- North Northeastern nonmetropolitan Ohio—This area is non-contiguous, a collection of fourteen counties without major metros in their borders. Out of 331,770 workers, 30 are architects. Their median wage is $47,540 and the average or mean wage is $51,730.
- Southwest nonmetropolitan Montana—This group of counties includes Yellowstone National Park. Of 137,660 employees, 270 people are architects. They have a $47,580 median wage and a very similar average wage of $48,630.
Missoula, Montana, which we saw as having the highest number of architects as a proportion of the workforce in the OES data, shows up in the bottom 15 cities for median wages. Missoula has a median wage of $59,100.

The areas with the highest median wages are:
- Watertown-Fort Drum, NY—Near the Canadian border, this area includes the town of Watertown and the Army base Fort Drum. 40 architects are in the area. The proportion of architects as part of the workforce is in line with the national average, so scarcity is not a factor in high wages! The median wage is $114,720 and the average wage of $101,680
- Kennewick-Richland, WA—This town in the southeastern part of Washington state has a low number of architects for the population, but the architects in the area are paid well. The median wage is $104,630 and the average $99,900.
- San Jose-Sunnyvale-Santa Clara, CA—This is the most populated area in the top three. Although there are 440 architects in the area, the ratio of architects to the working population is 1/3 the national average. Median wages are $103,8800.
Industry projections
As an industry, architecture is predicted to grow faster than other industries, with 8% growth over a decade, or 1,120 new jobs per year. A 2016 BLS projection report suggested that as people leave the industry for retirement or other opportunities, there could be up to 9250 replacement hires per year.
A 2018 report from the National Architecture Accrediting Board shows that 5,995 architectural degrees and 2,956 preprofessional degrees were awarded to students in 2018.
- 3,506 Master of Architecture
- 2,464 Bachelor of Architecture
- 25 Doctor of Architecture
- 2,956 Preprofessional Degrees
There are many organizations that hire architects into the community. Many architects work in a specialized architecture firm, but some work for engineering firms (7%), in government (2.7%) or in the construction industry (2.7%).
Notes on Data:
- Approximately 20% of American architects are self-employed. These architect wages are not captured by the Employment and Wages from Occupational Employment Statistics (OES) survey.
- State median wage data 2018 missing for Georgia and Montana, although these states do have some information captured in metro data.
- We removed Guam and Puerto Rico from our analysis: these numbers are available with the OES survey.
- Questions? Thoughts? Email us at [email protected]